TL;DR
Performance metrics tell you what happened; attention metrics explain why. By combining both, you remove the guesswork from campaign results. Learn how AI tools like junbi and expoze allow you to predict attention and optimize creative before media spend, ensuring maximum ROI.
Why We Need Better Advertising Metrics
We’ve long relied on clicks, impressions, and conversions as our “report card” for ad performance. But these classic metrics don’t always explain why an ad worked—or didn’t. Attention metrics go deeper, capturing where viewers focus, how long they stay engaged, and which elements truly stand out.
Think of it this way: you might see an ad (impression), even click it—but did it actually hold your attention long enough to make an impact? Understanding that distinction is what turns good ads into great ones.
What Are Attention Metrics?
Attention metrics capture how long and how deeply a viewer engages with your ad—beyond just viewing or clicking. They help you answer:
- Did people really look at the product or brand logo?
- Which parts of the creative drew or lost attention?
- What elements caused distraction?
For example, Mondelez found that ads with higher measured attention (through advanced tracking) drove a 9% lift in brand favorability and a 5% rise in purchase intent.
When ads capture attention, you improve awareness, recall, and the chances that viewers move down the funnel.
Some Methods to Measure Attention
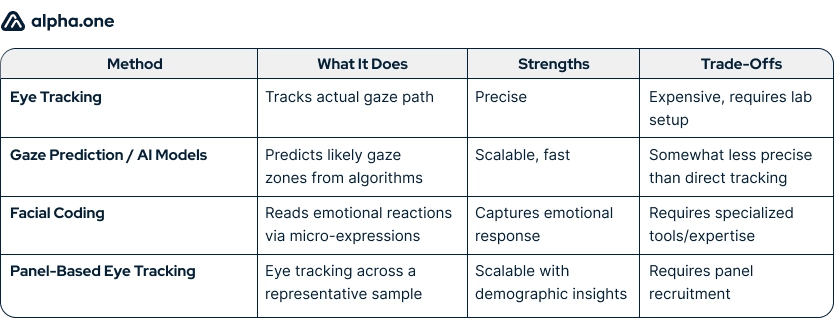
Attention can be measured in three ways: active eye-tracking studies (slow), proxy metrics like view duration (imprecise), or predictive AI modeling (fast and scalable). See how they compare below:
What Are Performance Metrics?
Performance metrics are your classic measures of how an ad performed after launch. They include:
- Click-Through Rate (CTR): Percentage who clicked after seeing the ad
- Impressions: Number of times the ad was displayed
- Engagements: Likes, shares, comments, interactions
- Viewability / Viewable Impressions: Proportion actually visible on screen
These metrics are great for showing scale and action—but they don’t always tell you why people clicked (or didn’t).
Limits of Performance Metrics
Performance metrics have blind spots:
- Vanity metrics: High impressions or clicks don’t guarantee interest or quality.
- Clicks can mislead: A “click” may come from frustration or error, not genuine engagement.
- Viewability ≠ attention: Ads can be technically visible but ignored while a user multitasks.
- Metrics may distort behavior: Focusing solely on clicks can push creatives toward clickbait rather than brand-building.
In short: relying on performance data alone can leave you guessing about why things failed or succeeded.
A survey from November 2022 found that 36% of U.S. ad buyers planned to shift more emphasis toward attention metrics — indicating a shift in industry practice.
Performance vs. Attention: Which Is Better?
You don’t have to choose one over the other. Instead:
- Attention metrics are increasingly viewed as predictors of performance. They reveal which creative elements will capture focus before you spend heavily.
- Performance metrics show you results: conversions, ROI, sales lift. They validate whether your creative/strategy actually worked.
- Use attention data in planning and iteration — then track performance data to confirm and calibrate.
Think of attention and performance as a before and after tool*.* One is not necessarily better than the other, but together? They can make a real difference in your strategy.
Attention Metrics: The Strategic Edge
Because attention metrics operate at the creative level, they let you:
- Test and optimize creatives upfront (before full launch)
- Allocate budget more smartly (toward formats or designs that reliably attract attention)
- Diagnose weak spots (e.g., logo under-seen, call-to-action ignored)
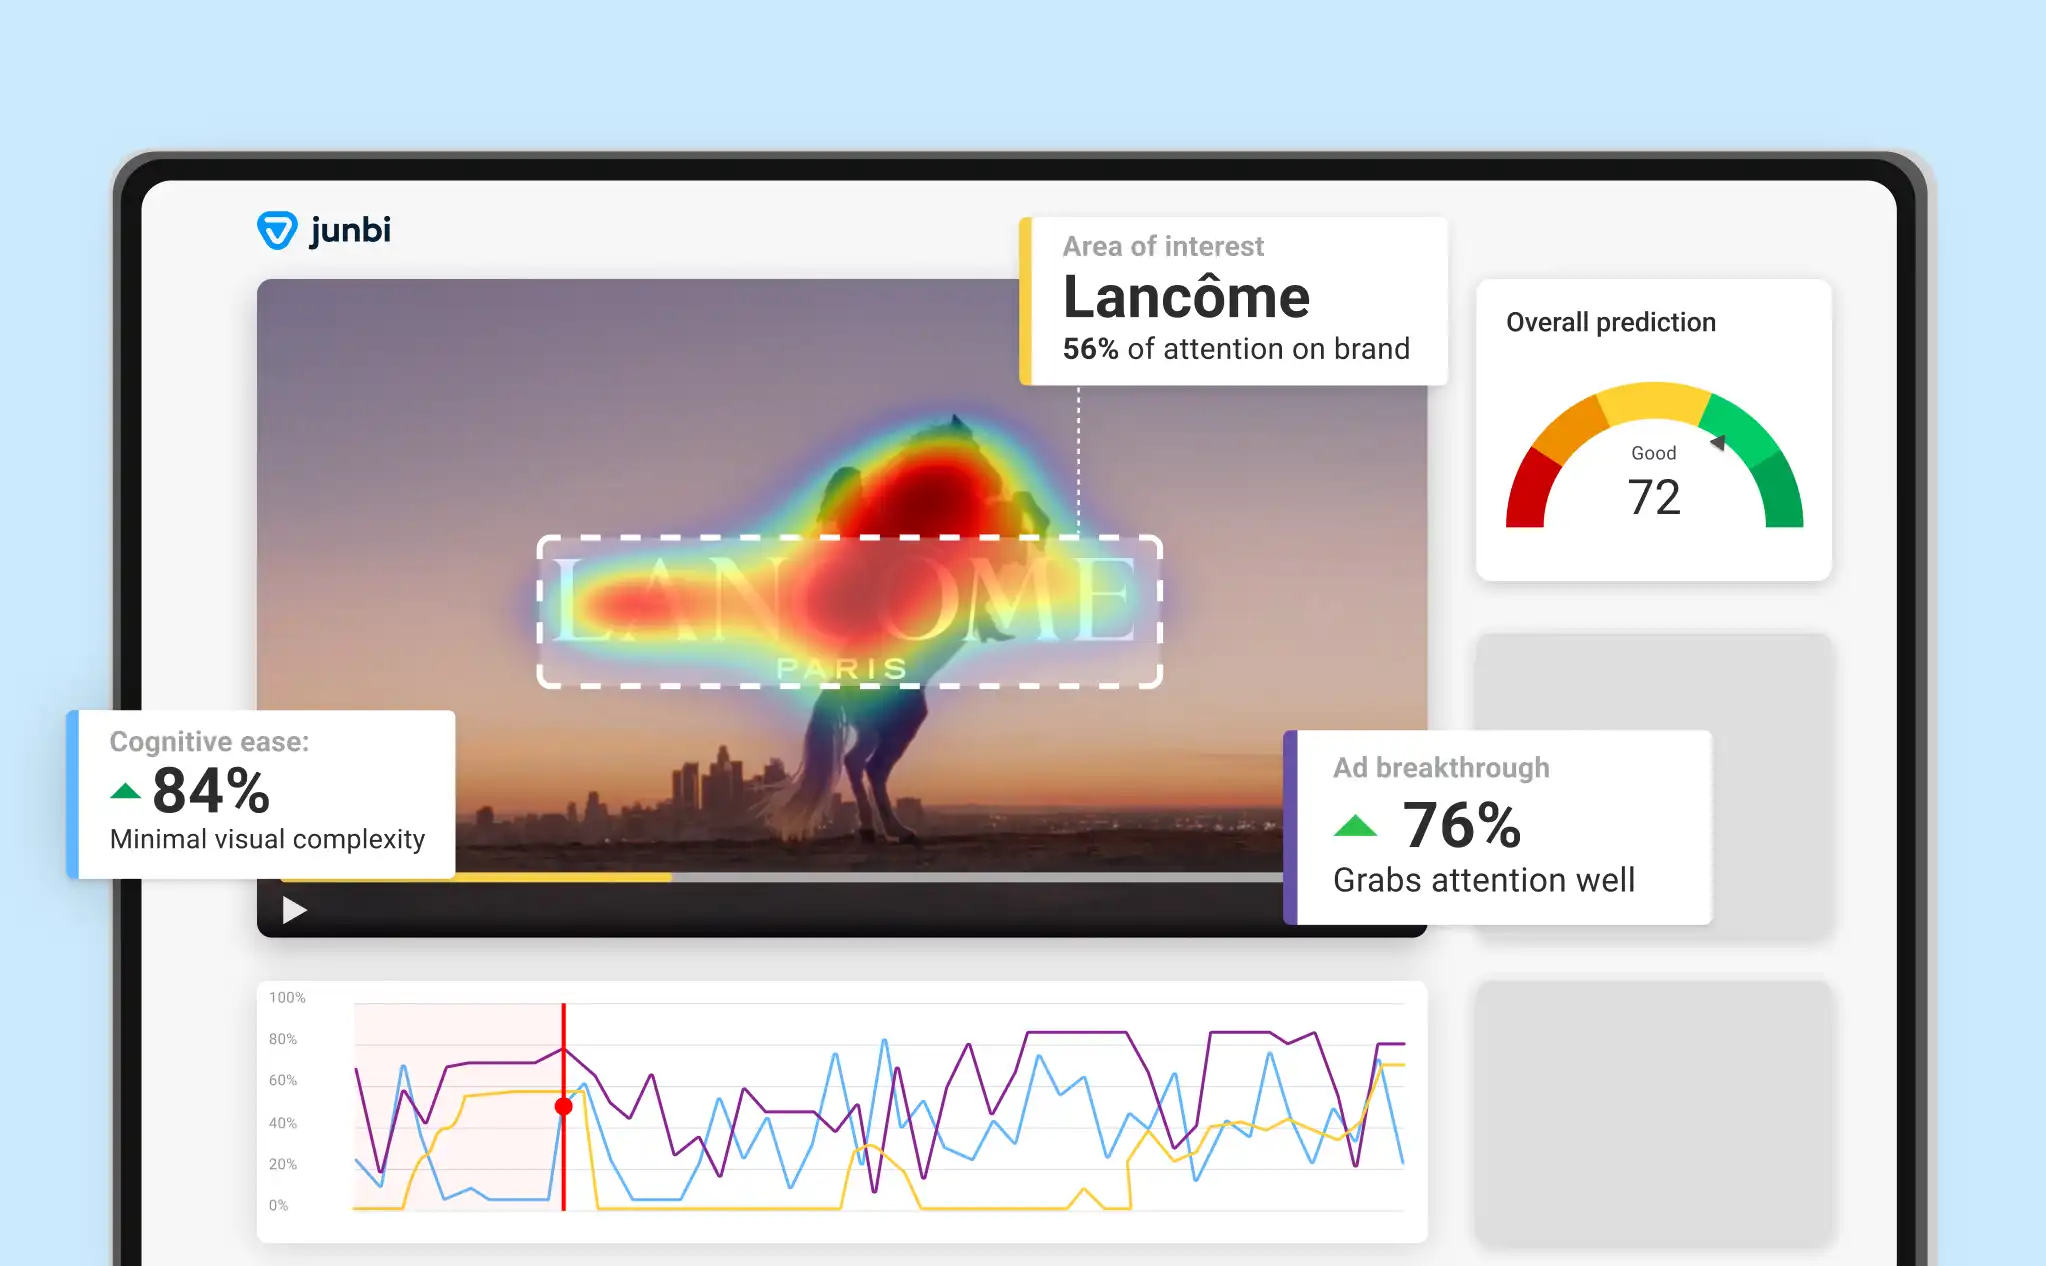
Tools like junbi and expoze use an attention prediction platform to predict attention, helping brands optimize their ads and boost ROI.
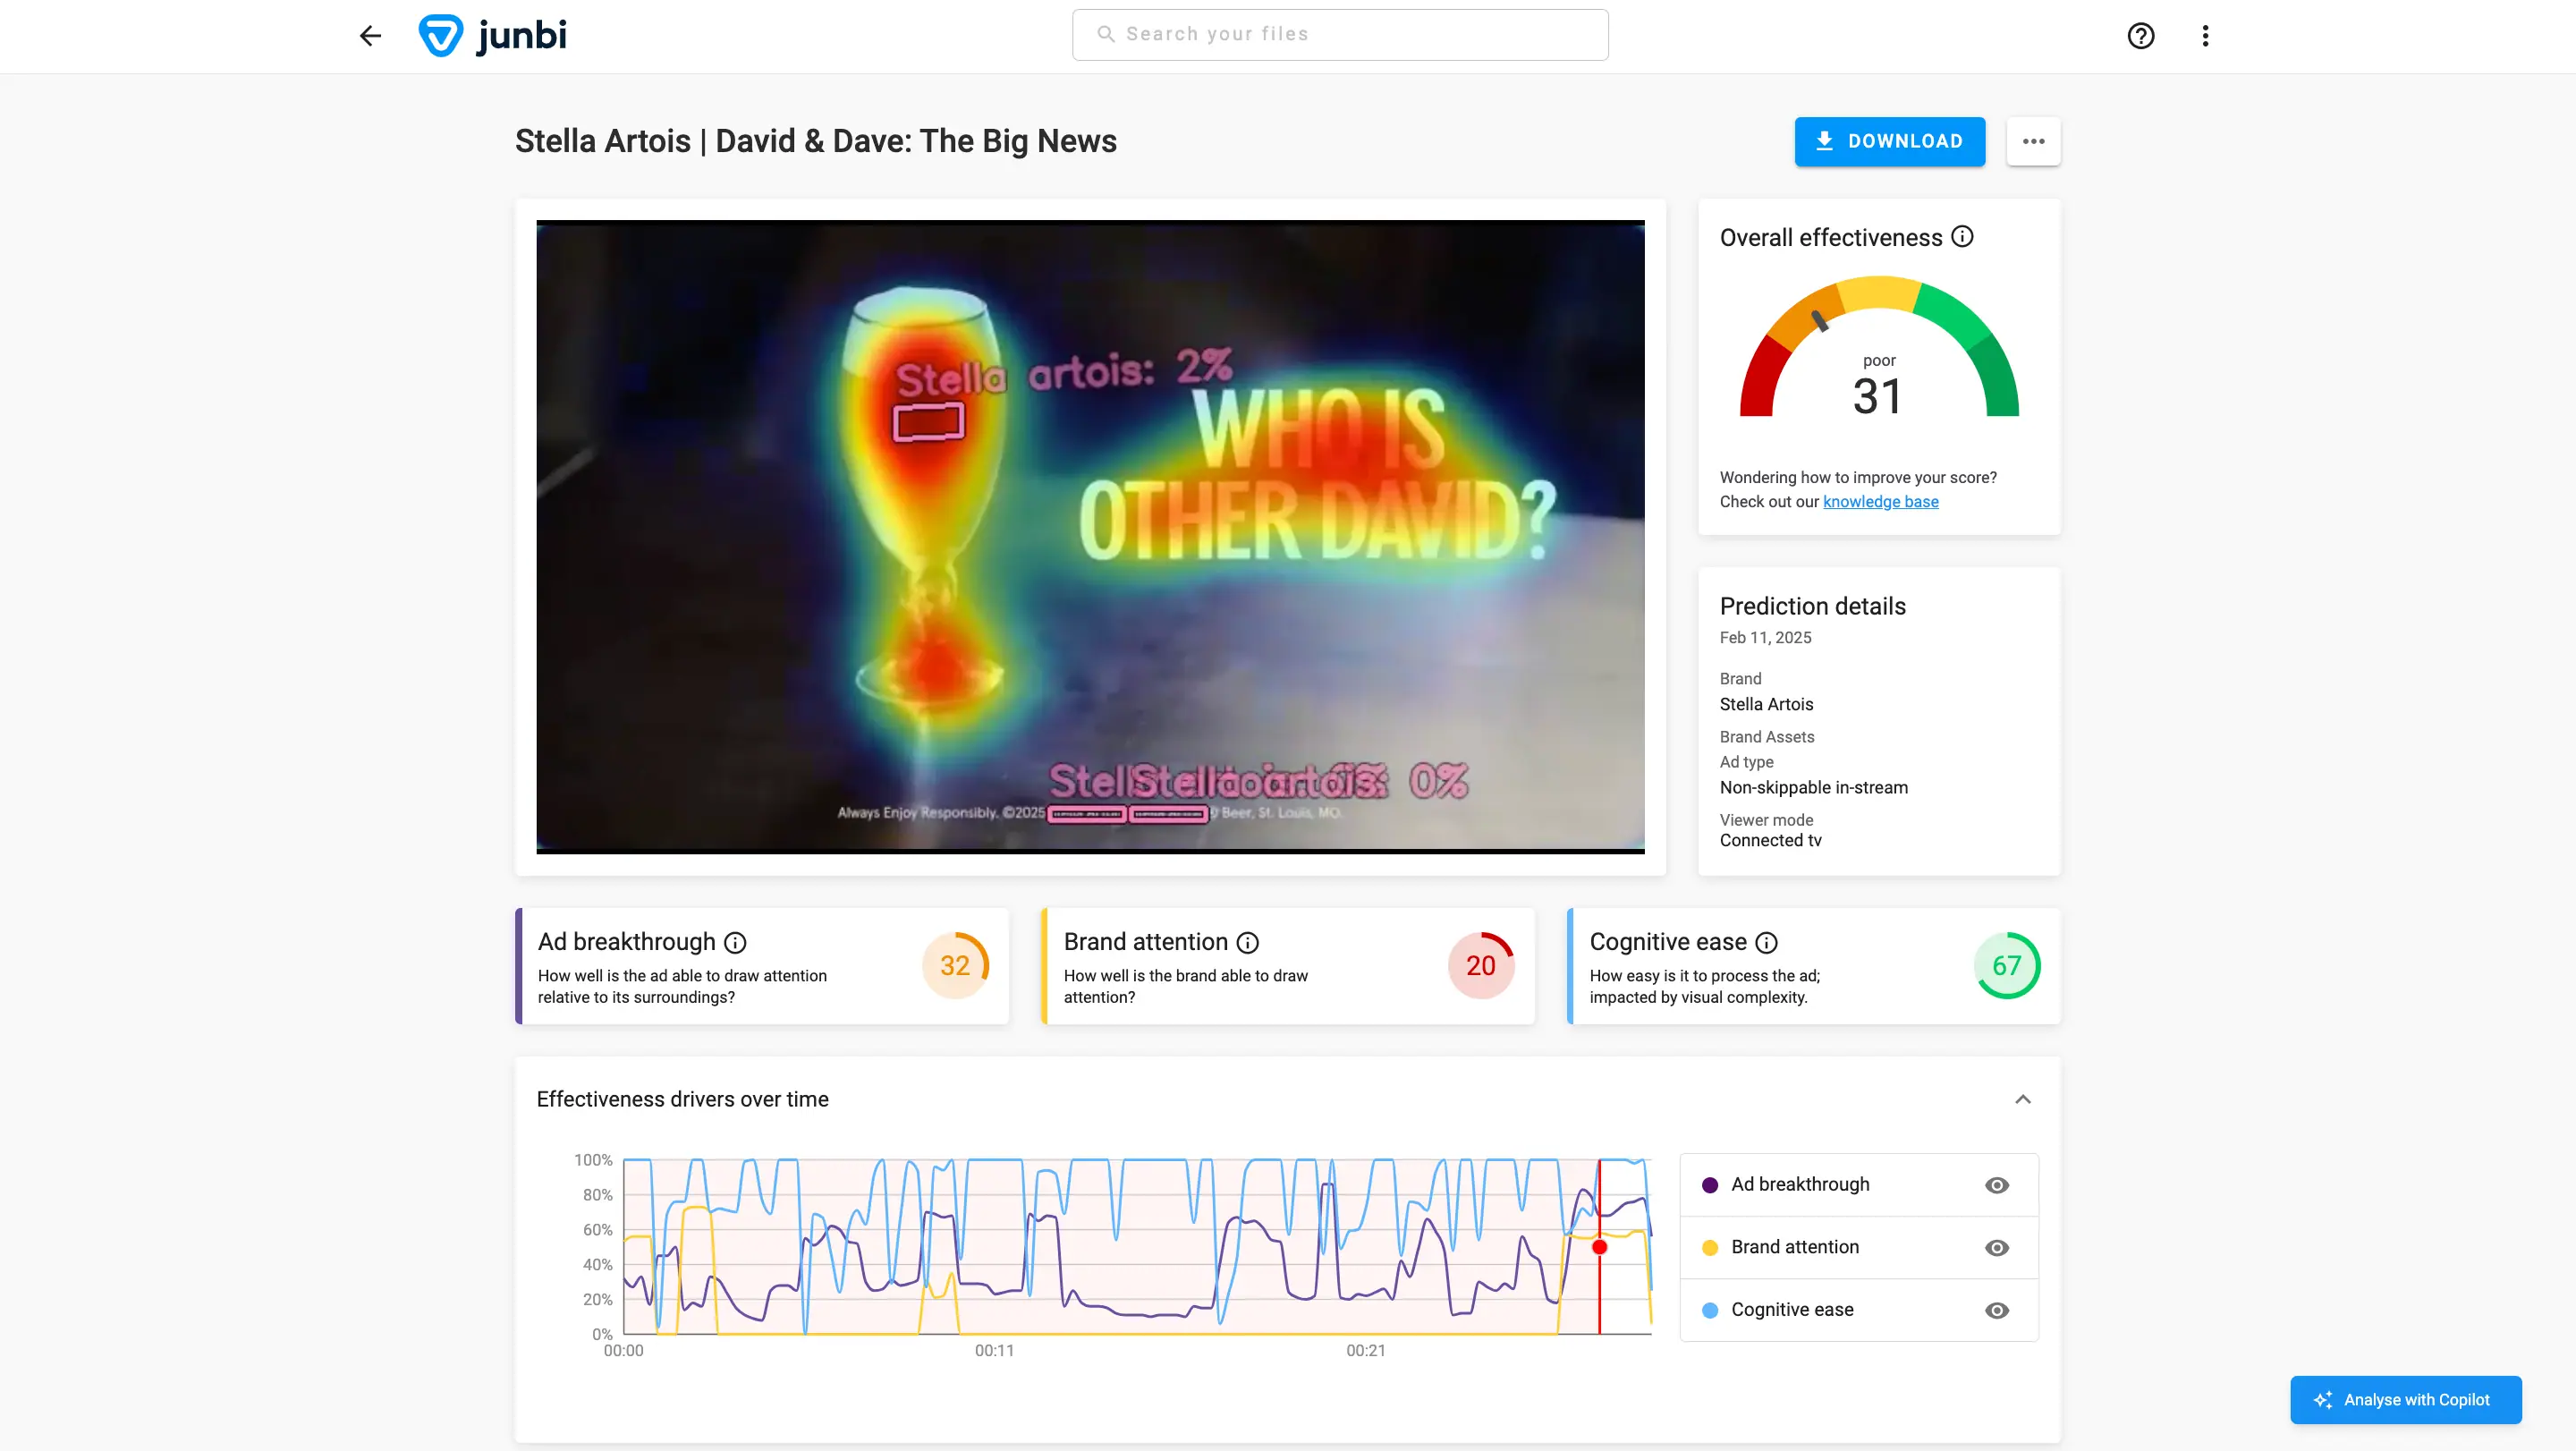
- junbi’s platform scores creative elements by Brand Attention (did they see the logo?), Cognitive Ease (is it hard to process?), and Ad Breakthrough (does it pop out of the feed?).
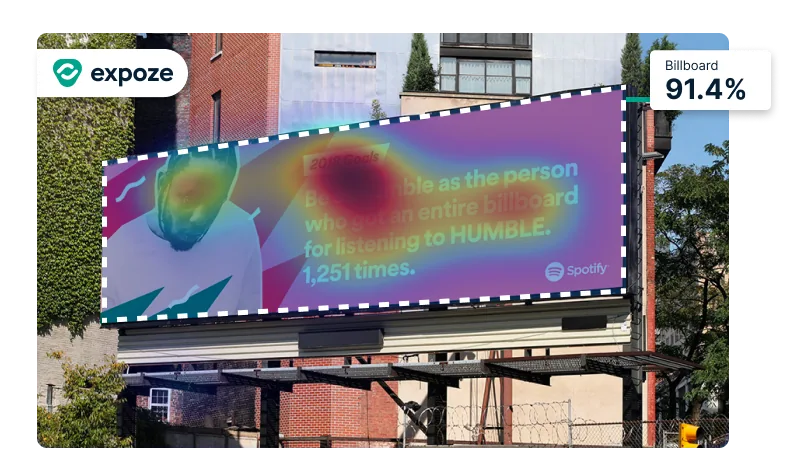
- expoze predicts what percentage of total attention an element (e.g. logo) will receive
Pro Tip: Combine the attention metrics offered by alpha.one’s tools with traditional performance metrics to give you a full story: what happened and why.
How to Embed Attention Metrics in Your Next Campaign
- Prototype + test early: Run multiple creative variants through attention tools before launching.
- Allocate smarter: Funnel budget to formats, visuals, or placements that consistently score high attention.
- Compare with performance: After campaign launch, correlate attention scores with conversions or ROI to validate—and improve.
- Iterate continuously: Use attention insights to refresh creatives mid-campaign rather than waiting until the end.
Conclusion & Next Steps
Performance metrics are still essential—the “what happened” scoreboard. But in 2025, attention metrics add the “how and why” dimension that helps you build better ads from the start.
Don’t choose between them—use both. Optimize your creatives with junbi + expoze insights, then validate performance metrics to confirm results.
Ready to get started?
- Book a demo with junbi and run your creatives through attention tests.
- Try expoze’s heatmaps to see which elements in your ads demand the most eyeballs.
- Plug attention metrics into your ad workflow and watch your efficiency and impact climb.