
Executive Summary: The Mechanics of Modern Attention
New peer-reviewed research published in the Journal of the Academy of Marketing Science (JAMS) establishes a link between video design features and viewer engagement. By analyzing moment-to-moment attentional synchrony, the study identifies three critical design aspects for high-performance video:
- The Complexity Tax: Visual "noise" (measured by visual saliency maps dispersion) results in a 26.4% decrease in collective focus per standard unit of visual complexity
- The Scene Cut Reset: Human attention peaks exactly 0.66 seconds after a scene cut, creating a biological window of opportunity for branding.
- Cognitive Ease: Low-complexity, short-duration scenes increase attentional focus.
Introduction: The Measurement Gap in Video Creative
For decades, video advertising has relied on "post-hoc" metrics—view counts, click-through rates, and brand lift surveys. While these metrics tell us that a video worked, they fail to explain the biological why.
To bridge this gap, we analyzed groundbreaking research recently published in the Journal of the Academy of Marketing Science (JAMS). This study utilizes state-of-the-art computer vision to decode human attention, led by a global team of experts:
- Sammy Wals (RWTH Aachen, DE)
- Dhruv Grewal (Babson College, USA)
- Ines Wilms (Maastricht University, NL)
- Tim Hilken (Maastricht University, NL)
- Alexia Briassouli (University of Twente, NL)
- Martin Wetzels (EDHEC Lille, FR)
Their findings confirm a fundamental truth that alpha.one has long championed: Cognitive Ease is the engine of engagement.
The research concludes that to maximize attentional focus, video scenes must remain “short and simple.” While varying scenes over time sustains interest, overly complex or long-duration shots risk overloading the viewer's limited processing resources—leading to "attentional decay" and lost brand impact.
The Snippet Trap: Defining Attentional Synchrony
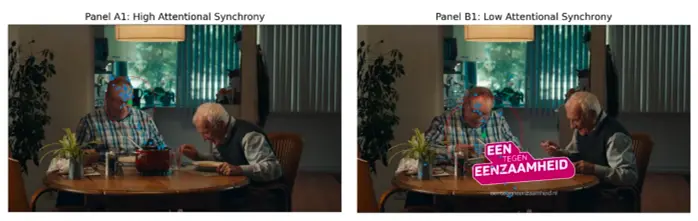
What is Attentional Synchrony? Attentional synchrony is a neuromarketing metric that measures the temporal alignment of visual focus across a group of viewers. High synchrony indicates that the majority of viewers are looking at the same element simultaneously. In video advertising, high synchrony predicts narrative immersion and superior brand recognition.
1. The "Complexity Tax": Why More is Often Less
In his study of 2,520 individual viewing experiences, the data revealed a "delayed negative effect" of visual complexity.
When a scene is visually "noisy"—filled with competing colors, movements, or text—the viewer's brain must work harder to find the signal. This increases Cognitive Load. The research shows a 26.4% decrease in attentional synchrony after a one-standard-unit increase in visual complexity.
The Managerial Takeaway: If your video tries to communicate three things at once, it communicates nothing. By using predictive tools, brands can identify this "complexity tax" before they spend a dollar on media. (Link to '9 New Display Ad Testing Templates for Figma')
2. The 0.66-Second "Golden Window": Engineering the Scene Cut Reset
One of the most actionable findings from the paper is the impact of scene cuts. A scene cut acts as a "reset," triggering what scientists call an orienting response in the brain.
- The Discovery: Attentional synchrony peaks precisely 0.66 seconds after a scene cut.
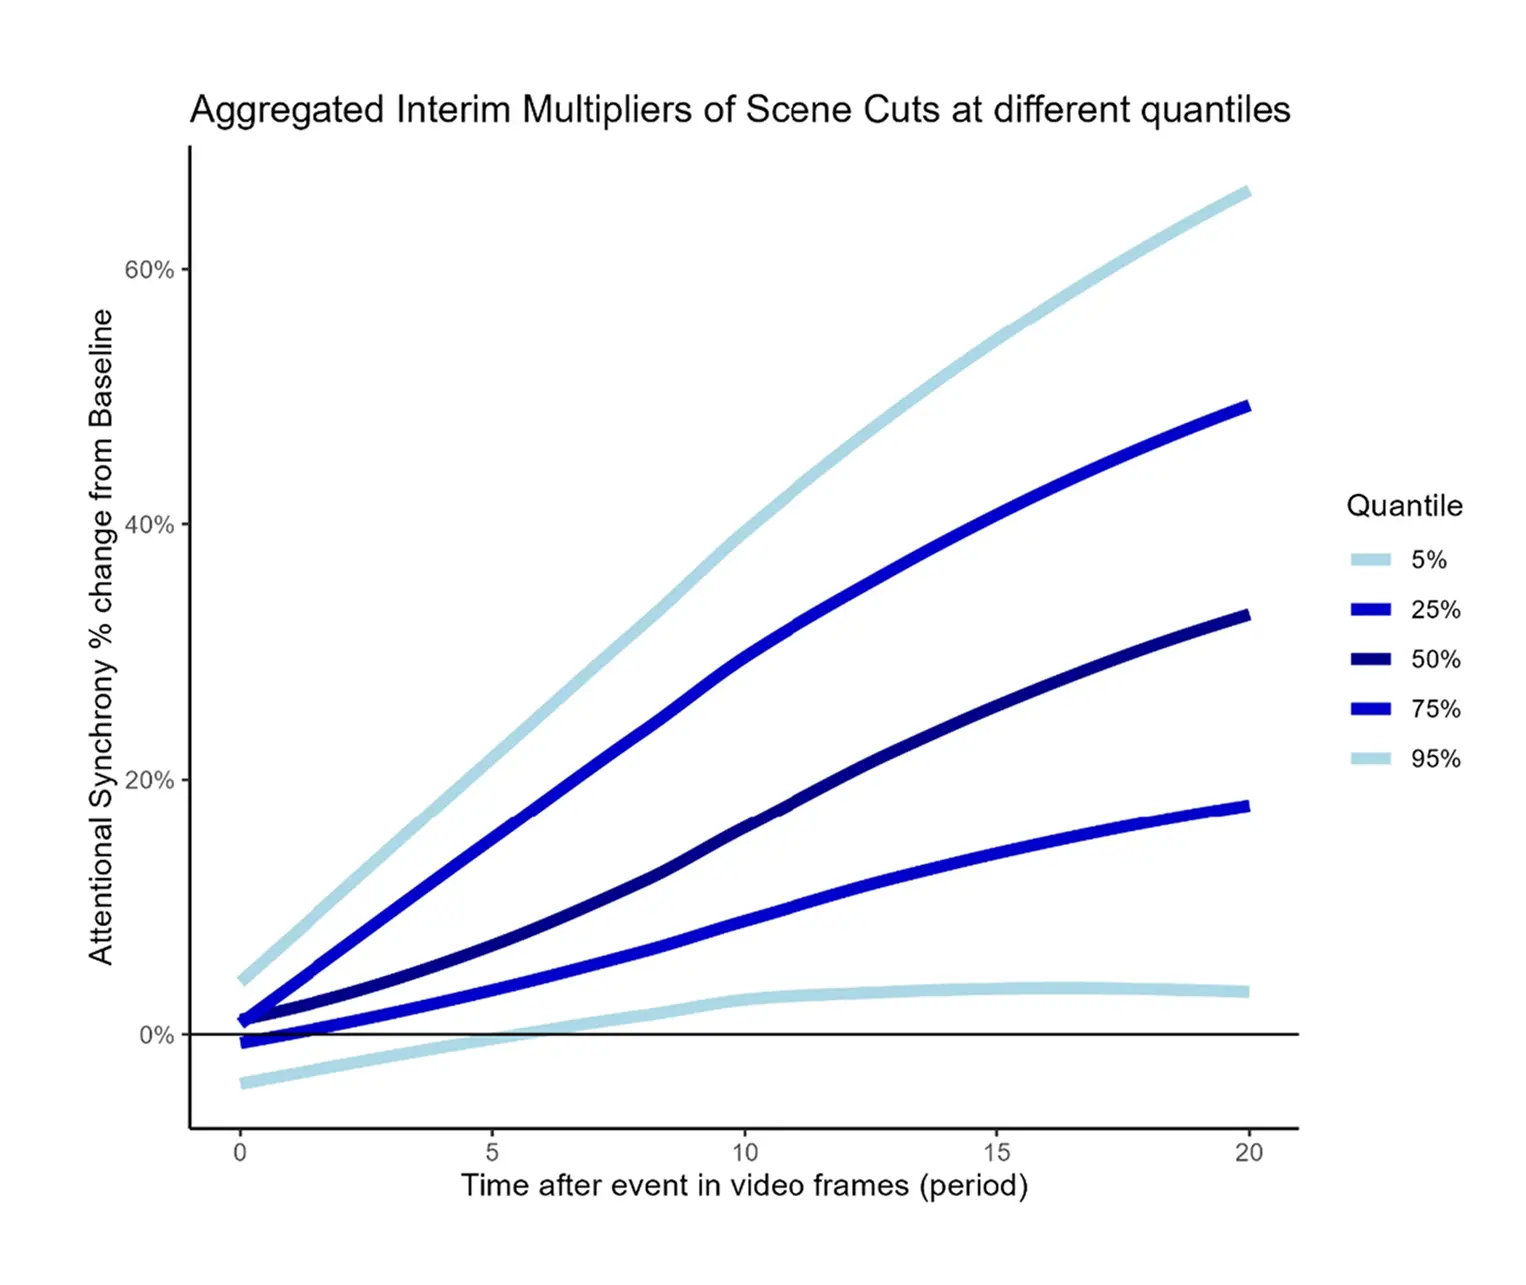
- The Strategy: If you place a brand logo or a call-to-action (CTA) within this window shortly after a scene cut, you are capitalizing on the brain's natural peak of focus.
3. The "Medium Shot" Trap
The research highlights a specific interaction between shot types and complexity. While Close-Up shots (focusing on a single face or product) naturally drive high synchrony, Medium Shots were found to be highly sensitive to the environment.
In a medium shot, if the background is complex, the viewer’s eye wanders. The study found that complexity has its most damaging effect on attention during these mid-range shots.
- The Fix: Maintain background simplicity during medium shots to ensure the narrative isn't lost to visual noise.
From Research to Revenue: Implementing Predictive Creative
Identifying a "Complexity Tax" or a "0.66-second peak" is the first step; the second is scaling that knowledge across a high-volume creative pipeline. This transition from theory to Applied Science requires moving beyond subjective reviews.
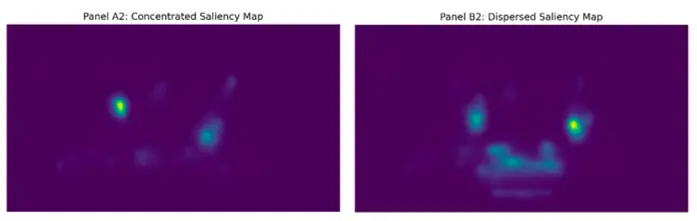
By utilizing automated salience mapping, creative teams can pinpoint "attentional drag" during the storyboard phase. As shown in Figure 2 (Panels A2 and B2), AI feedback allows us to detect when background pixels are competing with the primary narrative, enabling a "Creative Clean-up" that restores focus and improves brand recall.
Evidence in Action: To see these biological rules applied to global brand strategies, we have captured a deep-dive session between researcher Sammy Wals and alpha.one Co-founder Coen Olde Olthof. Their conversation bridges the gap between lab-grade eye-tracking and the high-speed workflows of the world’s leading creative teams.
This exclusive interview is currently in post-production and will be released shortly.
Subscribe to our YouTube Channel to get notified the moment it drops
Wals, S.F., Grewal D., Hilken, T., Wilms, I., Briassouli, A., & Wetzels, M. (2026).
The Dynamic Effects of Visual Complexity and Scene Cuts on Viewer Attention.
Journal of the Academy of Marketing Science. https://doi.org/10.1007/s11747-025-01137-x
.webp)
.webp)


