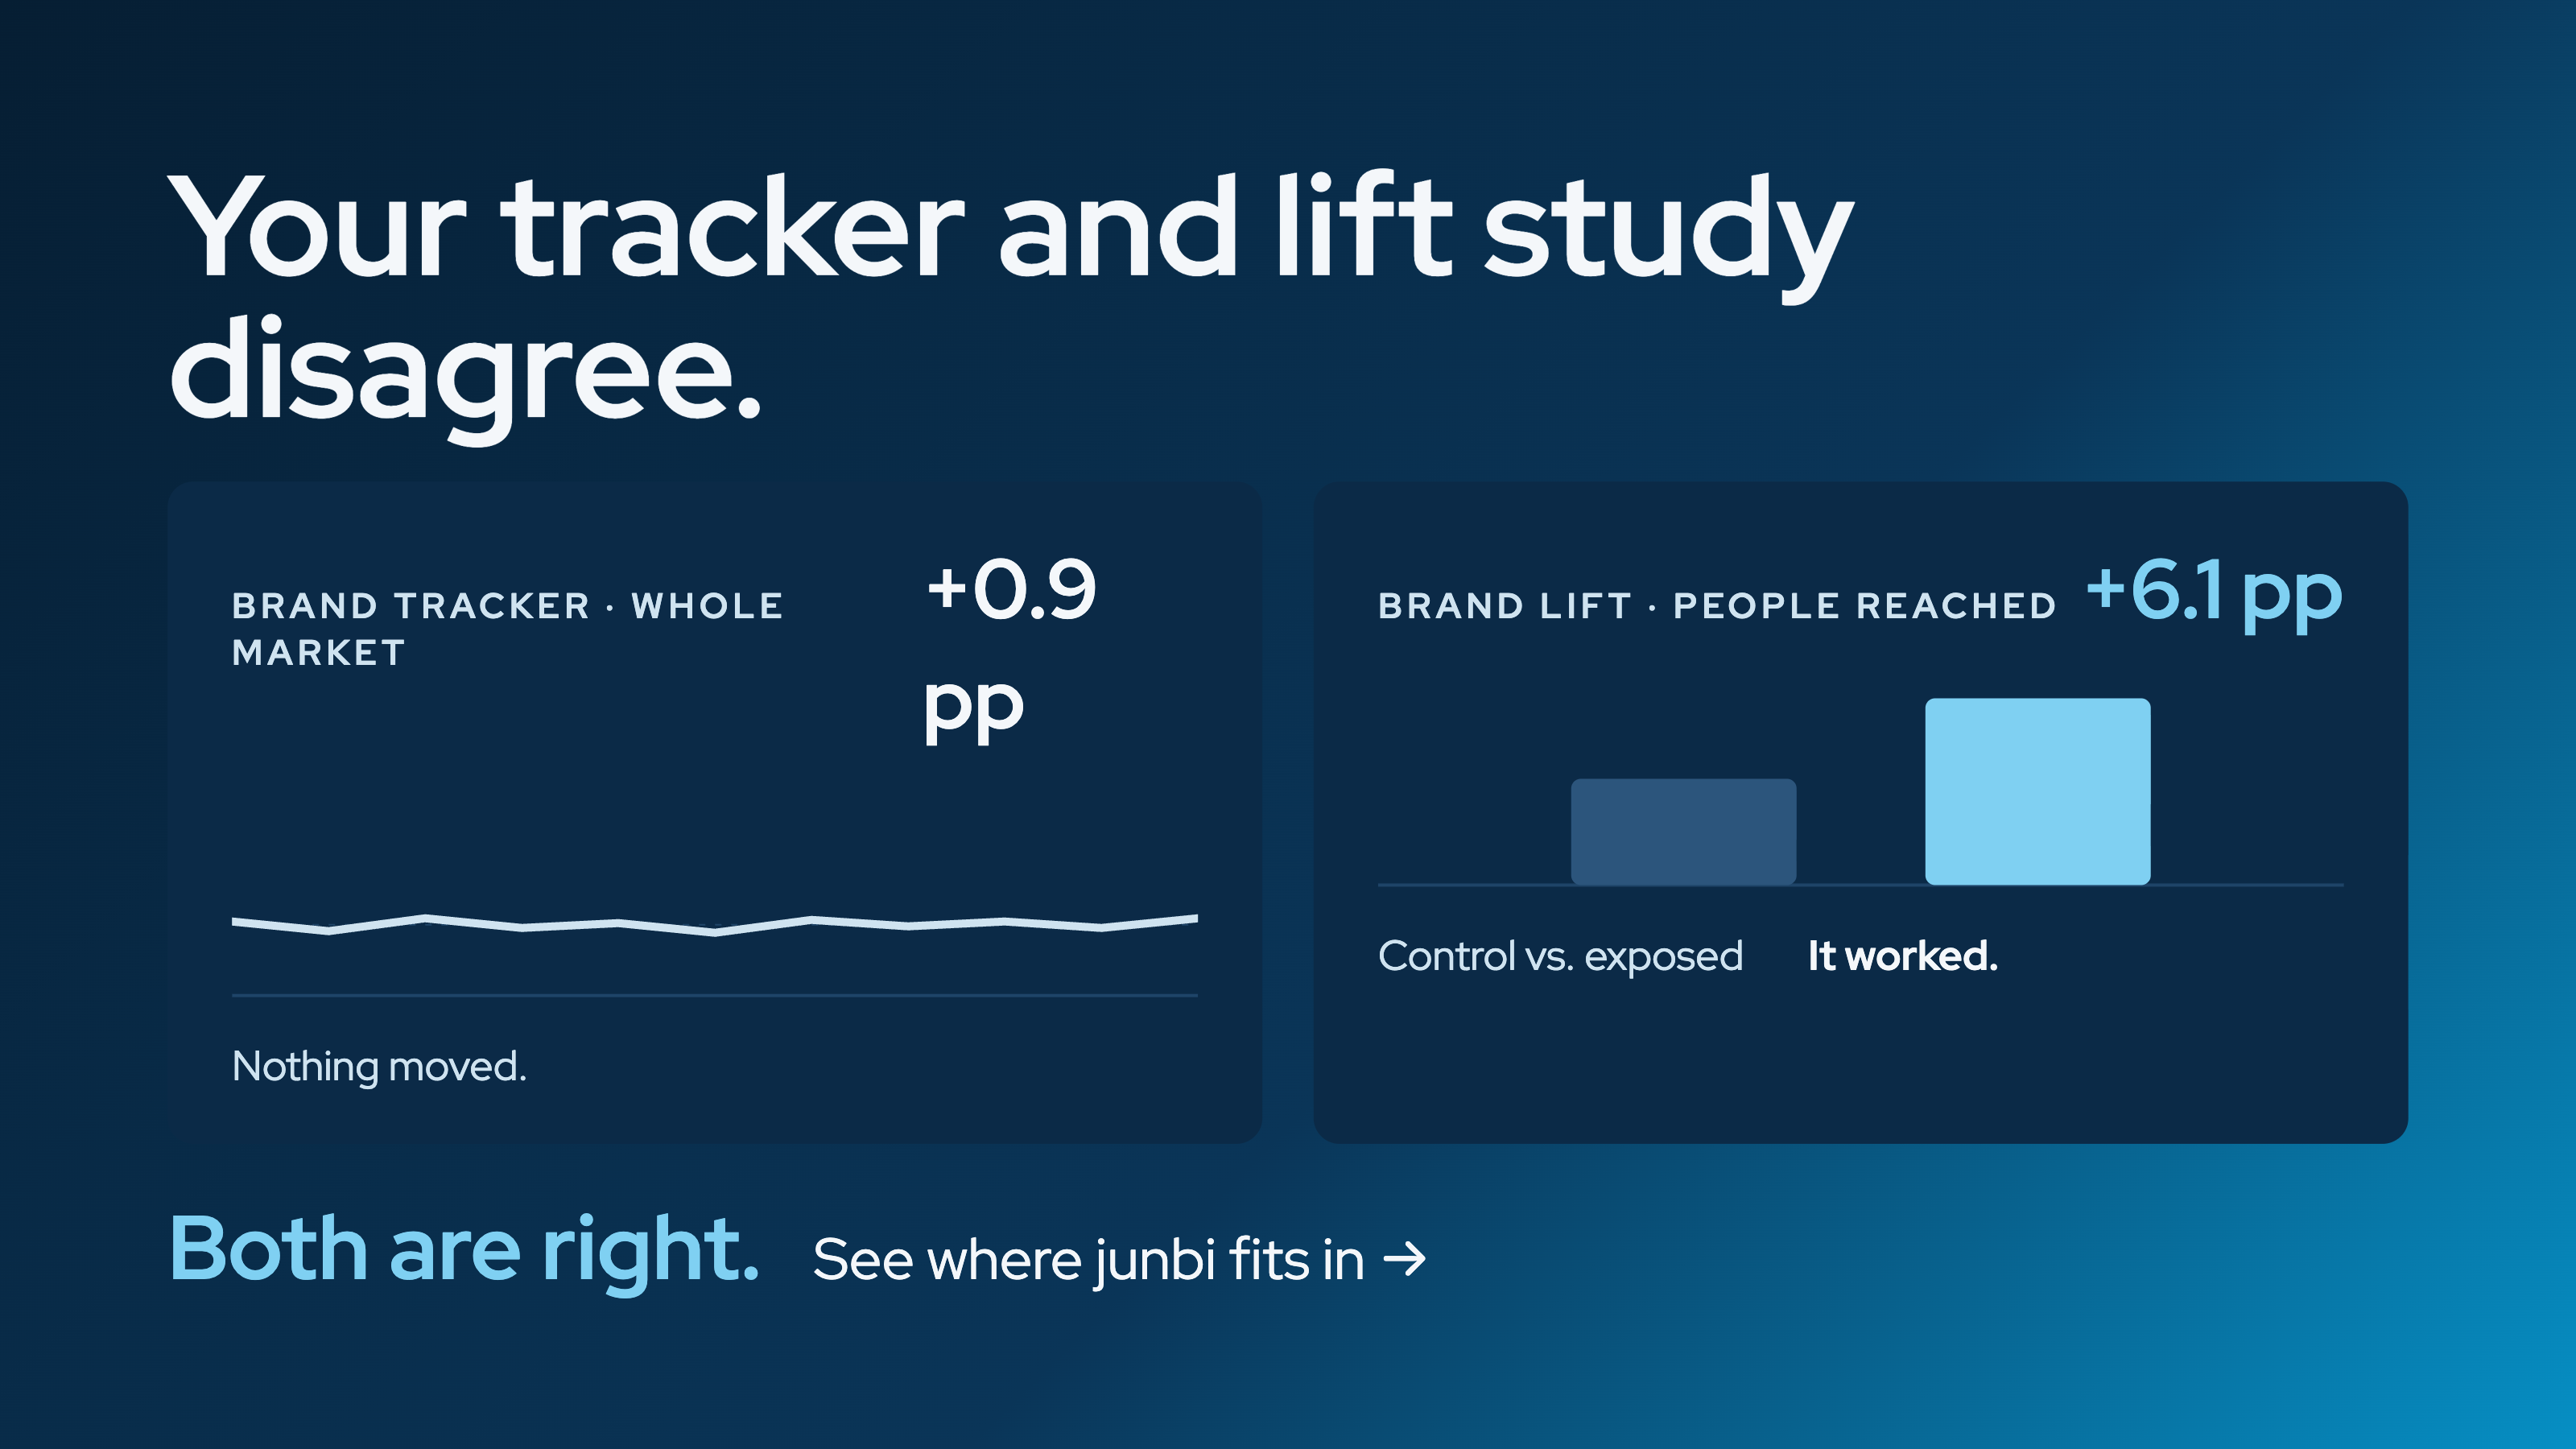

You have probably sat through this meeting. The media agency opens with the quarterly brand lift report: favorability up five points among exposed audiences, consideration climbing, campaign declared a success. Ten minutes later, the insights lead shares the brand tracker. Unaided awareness is flat. Preference hasn't moved. There might be a question, “the campaign didn't work”?
What follows is also a bit predictable. Creative gets to blame the media plan, media blames the creative or methodology, and some people starts to wonder whether either number can be trusted.
Here's the uncomfortable part: both studies can be right. When a tracker and a lift study disagree, the problem is rarely bad data. It's that we are asking different instruments the same question, and expecting the same answer.
Three Questions, Three Instruments
Brand measurement is not one scorecard. A mature setup uses multiple tools, each built to answer a different question at a different moment in a campaign's life.
The key distinction: tracking is correlational and macro; lift is experimental and campaign-specific. Expecting a tracker to judge a single campaign is like reading a national retail index to find out whether one store had a good weekend.
When the Data Splits: The Case of Brand A
Take Brand A, a challenger in smart home device. It sits in the category's top ten by media spend, yet outside the top four for spontaneous recall. It competes in the same channels as four established players, with a fraction of their share of voice.
Going into Q4, the brief was simple: the brand needs to be more known. Two studies ran side by side:
- A brand tracker: a representative sample of 1,150 category consumers, covering a nine-brand competitive set across the first half of the year.
- A brand lift study: a controlled design across social, linear TV, CTV, online video and programmatic display, comparing 1,204 exposed consumers with 692 matched controls.
The results told two very different stories. (To protect client confidentiality, the brand is anonymized and figures are indicative.)
Lens 1: The Tracker Says "Stuck"
Through the tracker, Brand N looked like it was treading water. On every classic funnel metric it ranked last of the nine brands monitored.
The management conclusion wrote itself: Brand N has an awareness problem.
Read the tracker for a brand of this size
Last place on every metric looks like a problem, but much of it is what research predicts for a small brand. Ehrenberg's law of double jeopardy shows that smaller brands have fewer buyers, who are also slightly less loyal. The same pattern runs through attitude data: people who use a brand are systematically more likely to agree with positive statements about it, a known effect called usage bias (Romaniuk & Sharp, 2000). In soft drinks, Romaniuk (2013) found a correlation of 0.74 between the number of associations a brand holds and its market share.
So Brand N scoring below the leader on trust or value is expected. The useful question is whether it scores below what a brand of its size should.
The more telling gap is between 62% aided and 2% unaided awareness. Most category buyers recognize Brand N when prompted, but almost none recall it unprompted. In Ehrenberg-Bass terms, that is weak mental availability: the brand rarely comes to mind when people are ready to buy. Fixing it means building more memory links to the moments people enter the category, not just repeating the name louder.
This is where creative pre-testing earns its place. A brand can only build memory if people look at the ad and notice whose ad it is. So two questions should come before any media is bought: does the ad break through in the context it will run in (ad breakthrough), and is the brand actually seen, second by second (brand attention)? An ad that scores well on breakthrough but poorly on brand attention can entertain people while doing little for the brand.
Lens 2: The Lift Study Says "Success"
While the tracker showed paralysis, the lift study showed clear progress among the people who actually saw the ads. Compared with unexposed controls, exposed consumers moved in the middle of the funnel:
- Brand familiarity: +6.1 pp
- Brand favorability: +3.9 pp
- Ad awareness: +4.8 pp
- Brand consideration: +2.2 pp
- Aided awareness: +2.4 pp
Perceptions moved too: +2.1 pp on Cares about its customers, +3.7 pp on A brand for people like me and +1.4 pp on A brand I trust. Shifts this small should always be read with their confidence intervals. With roughly 1,200 exposed and 700 control respondents, the margin of error on a metric near 30% is about ±4 pp.
In other words, the campaign appears to have moved the people it reached. So why didn't the tracker see it? First, a word on how far a lift study can be trusted.
Where Lift Studies Need Care
Lift studies are the right tool for campaign questions, but they are not automatically causal, and their breakdowns are easy to over-read. Three cautions matter here.
1. Matched controls are not randomized controls
Brand N's study compared exposed people with a matched control group. That beats having no control at all, but matching can still be far off. Gordon et al. (2019) benchmarked common observational methods against 15 large randomized experiments at Facebook, covering 500 million user observations and 1.6 billion ad impressions. The observational methods could not always reliably recover the true effect, and matching on age and gender reduced the bias without removing it. Where a platform offers randomized holdout groups, its still smart to use them.
2. Frequency and channel splits are correlational
Even in a randomized study, how often someone sees an ad, and on which channel, is not randomly assigned. Heavy viewers differ from light ones, so a dip at high frequency or on one channel may reflect who those people are rather than what the ad did to them. Subgroups are also small, and with many comparisons a few extreme results will almost always appear by chance. Treat these splits as hypotheses, then test them with a randomized frequency cap or a channel holdout before moving some or all of your budget.
3. What the research says about frequency
Controlled experiments give a more reliable picture of repetition than campaign splits:
- More exposures than most plans assume. A meta-analysis of experimental studies found brand attitude peaks at around ten exposures, while recall keeps rising and does not level off before the eighth (Schmidt & Eisend, 2015).
- Unfamiliar brands wear out sooner. Repeating ads attributed to an unfamiliar brand lost effectiveness faster than the same ads attributed to a familiar one, partly because viewers began to question the tactic (Campbell & Keller, 2003). For a challenger like Brand N, that is an argument for rotating executions rather than hammering one ad. Rotation only works if every execution is strong, so each version and cut-down needs testing, not just the master.
- Annoyance fades; memory stays. A field study found more annoyance with a heavily advertised brand at the time, but greater preference for it several weeks later (Kronrod & Huber, 2019). So short-term irritation is not the same as lasting brand damage.
Why Trackers and Lift Studies Disagree
Forcing the two into one blended verdict is a category error. The gap comes down to four structural realities:
- Reach. A tracker observes the whole category; a targeted campaign reaches only part of it. If a campaign lifts favorability by 5 pp among the 18% of people it reached, the whole market moves by about 0.9 pp (0.18 × 5). That is within a 1,000-person tracker's margin of error.
- Resolution. Isolate exposed respondents inside a 1,000-person survey and you may have only 150 of them. Against 850 unexposed, the smallest gap you can reliably detect is around 11 pp (80% power, for a metric near 30%), far larger than most campaign effects.
- Noise. A tracker absorbs everything at once: competitors with bigger budgets, price moves, distribution changes, PR and seasonality. One quarter of challenger media budget is a single small variable in a very big equation.
- Different questions. The tracker asks where does this brand stand in the market today? The lift study asks what did this campaign change among the people it reached? Both answers can be accurate and still point in opposite directions. And that might “feel” akward.
How to Build a Measurement Stack That Works Together
Ending the standoff means giving each instrument a clear job and a clear decision to inform.
- Stop using the tracker as a campaign report card. Use it for category dynamics, long-term trends and mental availability against competitors. Compare your scores with what is expected for a brand of your size, and separate users from non-users, so usage bias doesn't pass for a positioning problem.
- Make the lift study as causal as you can. Ask for randomized holdouts rather than matched controls, and report confidence intervals with every lift figure. This improves your judgement.
- Test frequency and channels; don't infer them. Treat frequency curves and channel splits as hypotheses. Run randomized frequency caps or channel holdouts before cutting budget, and rotate creative to delay wear-out, especially for a less familiar brand.
- Test creative before it starts to carry media budget, and use it to explain lift. The cheapest way to avoid wasted spend is to catch weak assets before launch. Pre-testing tools such as junbi score each version on ad breakthrough, brand attention and cognitive ease in minutes. The same scores help explain a lift result afterwards: when one version underperforms, they show whether it went unnoticed, whether the brand was missed, or whether it was too hard to process. Connecting the two is the interesting next step.
From Creative Scores to Brand Power
Creative pre-testing usually raises the same objection from finance and brand leadership: aren't you optimizing communication metrics instead of business metrics? The honest answer is yes, partly, and that's by design.
Scores like ad breakthrough, brand attention and cognitive ease are leading indicators. They are necessary conditions for brand effects: an ad can't build associations for a brand if people don't look at it, or don't notice whose ad it is. But they aren't brand power or sales on their own. The useful way to think about it is as a chain, where each link is tested separately:
- Creative scores. Does the ad break through in context (ad breakthrough), is the brand actually seen (brand attention), and is it easy to process (cognitive ease)?
- Brand metrics. Does it move the measures the brand team steers on, such as consideration, or a specific brand framework. (Like Kantar's Meaningful, Different and Salient? Or Ipsos – Brand Value Creator).
- Business outcomes. Do those brand measures translate into sales, typically through marketing mix modelling?
Which brand metric matters depends on the brand. For a challenger like Brand N, salience is the bottleneck: people don't think of the brand. Often its not what people think about your brand and more when they do. For a market leader that nearly everyone already knows, salience is largely in place, and the battle is consideration against competitors. That puts the focus on whether the brand feels meaningful and different, and on the specific associations it wants to own, whether functional (refreshing, quality) or emotional (time with friends). For such brands, a pre-test should check two things: whether the brand is seen, and whether the ad clearly carries the cues behind those target associations. The second is a content check, not an effect measurement, and should be labelled as such.
How much can a small data set prove?
Linking pre-test scores to a brand's own outcome data is the right move, but brands often have a limited set ads with good outcome data. That limits what can be concluded. With about 40 ads, only a correlation of roughly 0.3 or higher clears conventional statistical significance. Even a correlation of 0.4 comes with a 95% confidence interval of about 0.1 to 0.6. Splitting results by format or market shrinks the groups further.
That doesn't make the exercise worthless, but it changes how it should be run and read:
- Fix hypotheses and thresholds up front, before seeing the data, so nobody fits the story afterwards.
- Limit the analysis to a few pre-agreed metrics instead of testing everything, which guarantees some false positives.
- Favor within-ad comparisons. Comparing the first and improved version of the same ad needs far less data than comparing different ads.
- Check predictions against live results, comparing pre-flight scores with in-flight brand measurement.
- Treat the first round as calibration, then widen the data set across brands and markets before drawing firm conclusions.
It is also worth separating what is robust from what isn't. The attention model behind a pre-test can be validated independently, against eye tracking. junbi's model, for example, was trained on more than 10,000 images, each viewed by at least 50 people, and scores 0.87 on the MIT/Tübingen saliency benchmark, against 0.92 when eye-tracking data is compared with itself (alpha.one, scientific validation). The link between those scores and a specific brand's outcomes is a separate claim that has to be earned with that brand's data.
The Bottom Line
A positive lift report doesn't prove your brand strategy is sound. A flat tracker doesn't prove your media failed. Marketing effectiveness comes from knowing which instrument to trust for which decision: pre-testing to build creative that works, brand lift to tune campaign delivery, and tracking to steer long-term brand health.
Want to make sure your next campaign starts from creative that earns attention and builds the brand? junbi predicts breakthrough, brand attention and cognitive ease for your video ads before they go live, and expoze does the same for static assets. Get in touch to see how.
References
Campbell, M. C., & Keller, K. L. (2003). Brand familiarity and advertising repetition effects. Journal of Consumer Research, 30(2), 292–304. https://doi.org/10.1086/376800
Ehrenberg, A. S. C., Goodhardt, G. J., & Barwise, T. P. (1990). Double jeopardy revisited. Journal of Marketing, 54(3), 82–91.
Gordon, B. R., Zettelmeyer, F., Bhargava, N., & Chapsky, D. (2019). A comparison of approaches to advertising measurement: Evidence from big field experiments at Facebook. Marketing Science, 38(2), 193–225.
Kronrod, A., & Huber, J. (2019). Ad wearout wearout: How time can reverse the negative effect of frequent advertising repetition on brand preference. International Journal of Research in Marketing, 36(2), 306–324.
Romaniuk, J. (2013). Modeling mental market share. Journal of Business Research, 66(2), 188–195.
Romaniuk, J., & Sharp, B. (2000). Using known patterns in image data to determine brand positioning. International Journal of Market Research, 42(2), 219–230.
Schmidt, S., & Eisend, M. (2015). Advertising repetition: A meta-analysis on effective frequency in advertising. Journal of Advertising, 44(4), 415–428. https://doi.org/10.1080/00913367.2015.1018460
.webp)