



Struggling to know where to put that call-to-action button? Or maybe your brand logo just isn’t getting enough attention?
As a UI/UX designer, one of the biggest challenges is making sure the right elements stand out. That’s why clear layout, contrast, and visual clarity—essential principles for usability—are emphasized in design guidance like Designing a Positive User Experience from Think with Google.
This can be achieved through the proper use of visual hierarchy.
What Is Visual Hierarchy?
Visual hierarchy refers to the way design elements are organized to signal their importance. This guide by Canva offers a clear breakdown of how visual flow, contrast, size, and spacing influence what users notice—and in what order. Mastering this concept is essential for UI/UX designers aiming to create interfaces that are not only beautiful but also effective.
But how can you validate the visual hierarchy of your design? Typically, this would involve hours of user-testing or asking people for their thoughts on your design. These methods can sometimes be effective but can be very subjective. This is because a lot of the activity in our brain when processing visual information is happening subconsciously. Particularly in the first few seconds. So, people generally find it hard to express what they truly see or what grabs their attention.
Traditional Eye-Tracking: Accurate, but Slow
A good scientific alternative is traditional eye-tracking, whereby a group of people are shown the design (e.g. a website, app), and their eye movements are tracked using a camera or eye-tracker and specialized computer software such as Tobii Pro Lab. This will produce a heat map of where the person looked the most while they were being tracked. However, to get valid results a controlled environment is required. Otherwise, the data collected may be unreliable, and difficult to produce any meaningful insights for designers. It’s also time-consuming and very expensive to get a decent sample size to see any patterns in your results.
This is where predictive eye-tracking comes in. Using AI, you can predict which visual elements are most likely to get the attention of viewers. Therefore avoiding the hassle of asking people for their subjective opinion and saving the time and effort of setting up a scientific eye-tracking study.
Predictive attention models are trained on real eye-tracking data and visual saliency research. According to a recent study on attention prediction, modern neural networks can simulate gaze behavior across diverse media formats. Tools like junbi build on this to deliver real-time, scalable insights into visual hierarchy.
What is Predictive Eye Tracking, and Why Does it Matter?
Predictive eye-tracking is an AI-powered method that simulates human eye movements to estimate where viewers are most likely to look. Unlike traditional methods, it doesn't require human participants or specialized hardware.
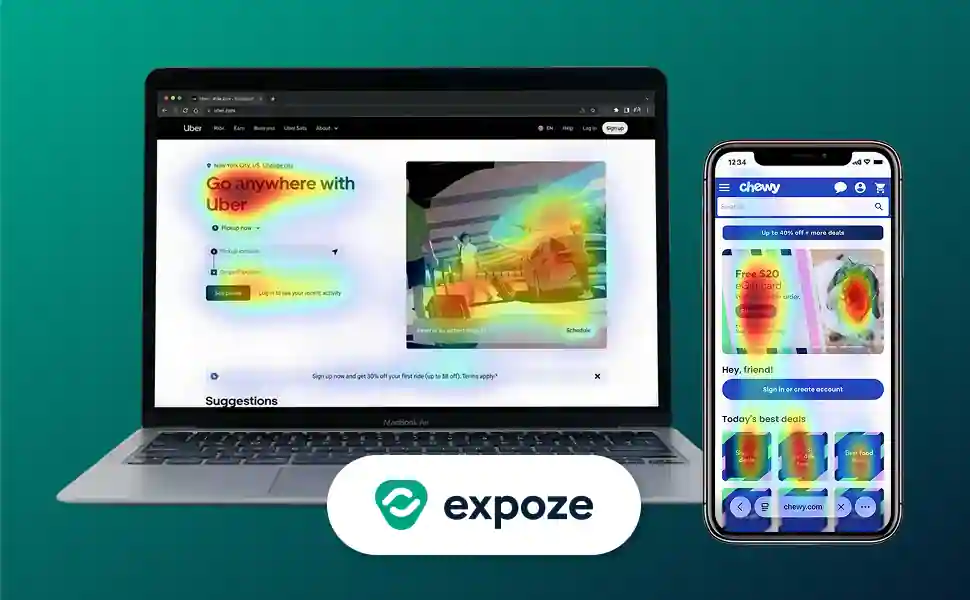
As the name suggests, predictive eye-tracking works similarly to traditional eye-tracking—but faster and more scalable. With the power of AI, it’s now possible to create a realistic prediction of where people will look, simply by uploading your design. The result is a heat map overlay on the visual content, closely resembling what you would expect from a lab-based eye-tracking study.
You can see the difference between the two types visualized in our analysis of an AXE ad below:
So, why is predictive eye-tracking so important for UI/UX designers? Well, in terms of validating visual hierarchy it’s the best possible solution currently available to designers for 3 key reasons:
- Heat map generation is nearly instant, and thanks to handy features like our Figma plugin you don’t even need to leave your existing workflow to validate your visual hierarchy.
- The results you receive from predictive eye tracking can be much easier to interpret than real eye-tracking data. As you may have noticed in the video above - traditional eye-tracking heat maps can be a bit messy, with attention ‘blobs’ scattered around the media. This is due to random eye movements which can vary between individuals. However with predictive eye-tracking, the heatmaps give a clear indication of where the attention is likely to go for a much broader audience, so your prediction does not suffer from individual bias.
- You can quantify your findings. With traditional eye-tracking, your only measure of how much attention you can get on visual elements is a guesstimate of how big the ‘blob’ is on your heat map. But with expoze.io you can create Areas of Interest which will give you a quantitative score of how much attention is on each area you define.
5 Steps to Validate Visual Hierarchy Using expoze.io
Step 1: Identify the Goal of Your Design
We know that proper use of visual hierarchy will attract attention to the most important elements of your design. This is great but first, you have to define what the most important elements of your design are.
This will of course depend on the overall goal of your design. Are you creating a landing page? Or a billboard? Perhaps it’s a mobile checkout interface? It doesn't matter. But what does matter is that you clearly define what you want the user to do next.
Let’s take the example of a landing page. If you’re designing a landing page, you’re probably attracting customers from some kind of online ad where you’ve already piqued their interest. Now you have to educate them on the USPs of your product and entice them to click your call-to-action button.
Of course, you want to make sure you have clear, readable text that succinctly communicates the benefits of your product or service. But most importantly, you want to have a nice clear call-to-action button that has enough contrast and white space around it that no user will ever miss.
Step 2: Map User Flow and Prioritize Elements
Assuming we’re sticking with the landing page example - we now know that the goal is to get the user to sign up for your product and/or service. But there are still going to be a few steps they need to take before getting there. You need to show them your product. Educate them about what it is and why it’s important for them.
This requires a clear visual flow, whereby a visual hierarchy can be used to direct the user’s attention in a certain way.
Discuss with your team which elements are most important, then prioritize the order in which they should be viewed. This should ultimately lead to the final visual element (the call to action). You can keep it simple at this stage. Start experimenting with wireframes or even simple drawings of your design. At this point, it’s only meant to be about the visual flow between elements.
Step 3: Build and Prototype Design Variations
Once you know the order in which you want your user to view your design, start putting together your prototype design. Tools like Figma and Adobe XD are perfect for this, as they allow you to rapidly change and experiment with different formats.
This phase is where you can try to experiment with different elements of visual hierarchy: Such as typography, white space, contrast, alignment, and so on. The elements of visual hierarchy are well covered by the Interaction Design Foundation’s article on Visual Hierarchy.
Make sure you have at least two variations of your design - as you will need to test them at a later stage to see which will better achieve your goals. In the example below, we decided to experiment with the use of an image as a background versus a full plain white background. This is to explore what difference it would make on the attention to the call to action (sign up) button.

Step 4: Upload Designs and Generate Heatmaps
Once you have created multiple designs in your chosen format, you now need to validate that the most important elements receive the most attention. Normally, you could do this with user testing and perhaps eye-tracking if you have the time and budget. But thanks to expoze.io you can validate your visual hierarchy in seconds.
If you’re working in Figma, install the expoze.io Figma plugin and log in to your account. If you’re using other tools, you can simply upload a screenshot of your designs to the expoze.io web application.

Select the frame containing the first variation of your design, and click ‘create heatmap’. It should only take a few moments to process your design, and you will receive a heatmap output that visualizes where the most attention is on your design as seen below. If you’re using the web application, we recommend you set up Areas of Interest (AOIs) on your most important visual elements to quantify how much attention they are receiving.

Now you have your first AI-generated attention prediction! Do the same for your second design variation, and set up the AOIs to compare which variations grab more attention on the key elements.
Step 5: Compare AOIs and Pick the Best Layout
Time to say goodbye to endless discussions about which design is better. Now you have real scientific proof of which of your designs will get more attention on the important elements. Take a look at the AOI values you generated in expoze.io and see which variation gets the most attention to key elements.
For our example landing pages, we can see that design 1 (white background) is predicted to capture 9.2% of attention on the CTA button, compared to 4.6% for design 2. That’s twice as much attention, just by tweaking the background and page layout! I think we may have a clear winner…

Why Designers Should Rethink Visual Validation in 2025
The design landscape is evolving fast—and so are user expectations. Traditional methods of validating visual hierarchy through interviews, surveys, and eye-tracking labs still have merit, but they no longer fit the speed or scale required by modern teams.
In 2025, predictive eye-tracking offers a powerful alternative. It lets designers:
- Validate key design decisions before launch
- Quantify attention without relying on user guesswork
- Compare layouts quickly using native tools like Figma
More importantly, it empowers teams to design boldly—because you can now test fearlessly. With tools like expoze.io, validating your visual hierarchy becomes part of the creative process, not a bottleneck after it.
The future of UX validation is fast, creative-first, and AI-enhanced. The only real risk is not testing at all.
Don’t let your next landing page become a missed opportunity.
Validate your visual hierarchy in seconds using the tools you already use.
👉 Try your first 5 images for free — and check out our Figma + Adobe Photoshop plugins.

.png)


